Correlate metrics, gain interactive dashboards, automate workflows, and receive unified notifications at your fingertips.
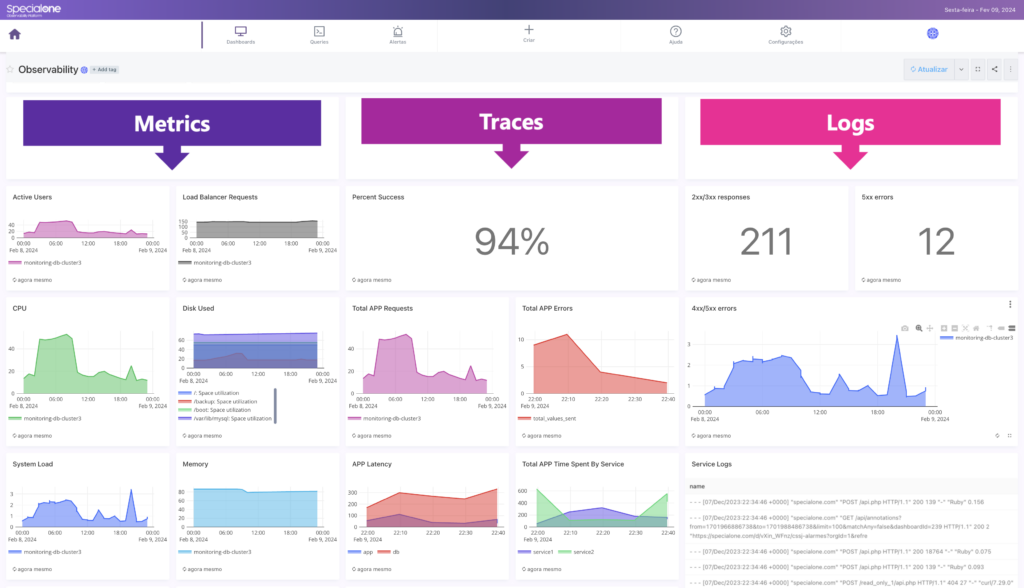
Synthesize all your data into a single dashboard
Through the SpecialOne observability platform, consolidate comprehensive views containing infrastructure performance metrics, application traces, and logs into a single dashboard. Create executive views by aggregating business metrics as well.
Customize views that matter to your business
Highlight current KPI values, critical SLOs, and SLAs with alerts directly on your dashboards. Build data with charts, numbers, words, maps, top lists, and more.
Share dashboards and enhance data insights with correlated data and custom functions
Utilize integrated collaboration features of SpecialOne to share panels with authorized personnel during investigations. Generate public dashboards with authentication to provide real-time visualizations. Compare metrics month-over-month or during custom periods.
Eliminate false positives and receive actionable and correlated alerts
Prioritize issues that matter most to your business without unnecessary triggers and actions. In our platform, each application, infrastructure, and service alert is specific, actionable, and contextual. You can also create dependencies to correlate alerts even in critical, dynamic, and high-volume environments.
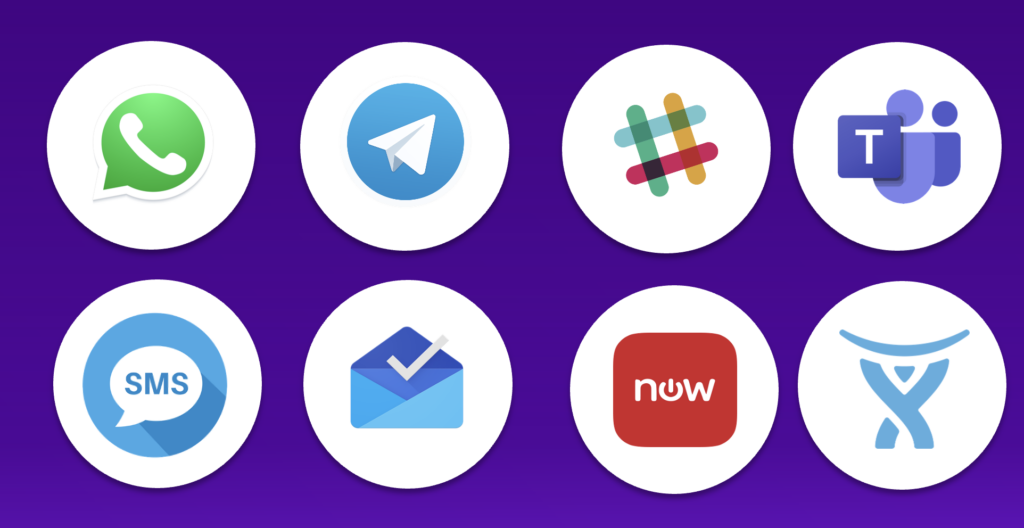
Automatically connect with your existing workflow
Easily route alerts and notifications directly to communication tools like WhatsApp, Telegram, Slack, Google Chat, and Microsoft Teams. Automate ticket creation in Jira Service Management, ServiceNow, and other ticketing and tracking tools. Receive escalated calls for high-criticality business issues.
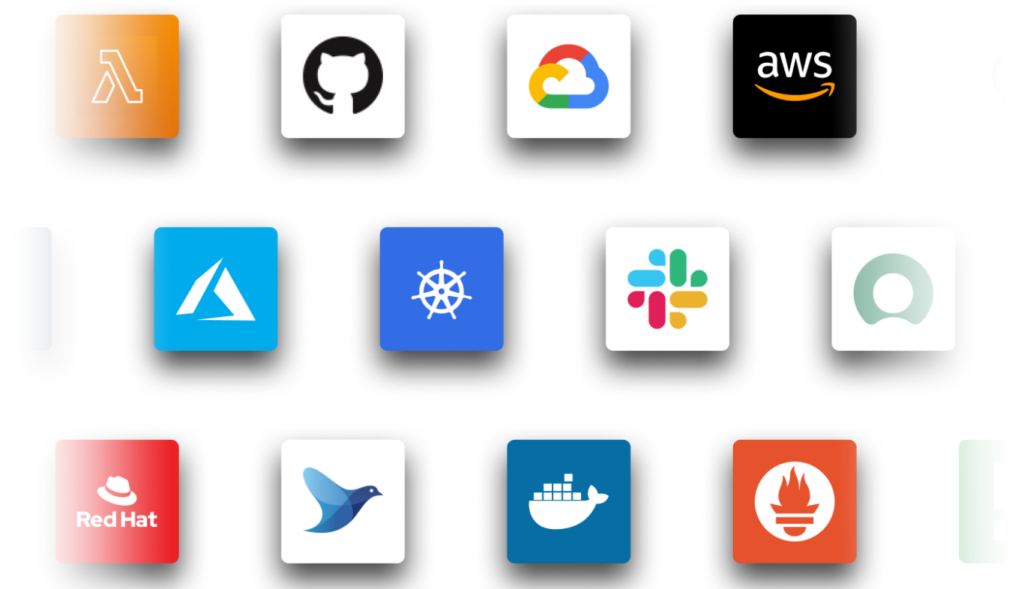
Automatically integrate with leading cloud platforms and solutions
The SpecialOne observability platform is open and extensible, seamlessly integrating with over 500 technologies and public, hybrid, and private cloud solutions.